Confidence intervals: explain uncertainty without promising certainty
In this article (6 sections)
A confidence interval expresses uncertainty through a procedure with a stated repeated-sampling coverage property under its assumptions. A 95% interval is not a guarantee that the next observation lies inside it, and it is not automatically a 95% probability statement about a fixed parameter after the data are observed.
Explain the estimated quantity, the method and the assumptions alongside the endpoints.
Calculate a mean interval
The analyst statistics lab includes eight synthetic control scores with mean 41.5. Under an independent normal-observation model with unknown variance, a t interval provides an interval for the population mean.
import numpy as np
from scipy import stats
from build_and_verify import CONTROL, mean_interval

estimate, low, high = mean_interval(CONTROL, confidence=.95)
se = CONTROL.std(ddof=1) / np.sqrt(len(CONTROL))
margin = stats.t.ppf(.975, df=len(CONTROL)-1) * se
assert estimate == 41.5
assert np.allclose([low, high], [estimate-margin, estimate+margin])
assert np.allclose([low, high], [39.452175327715885, 43.547824672284115])
print({'mean': estimate, 'lower95': low, 'upper95': high, 'n': len(CONTROL)})
NIST's confidence limits for a mean describes this interval form and its interpretation. The small fixture is a calculation example, not evidence that arbitrary eight-row business data satisfy the model.
See coverage across repeated samples
import numpy as np
from scipy import stats

rng = np.random.default_rng(20260921)
samples = rng.normal(100, 20, size=(5000, 25))
means = samples.mean(axis=1)
margins = stats.t.ppf(.975, 24) * stats.sem(samples, axis=1, ddof=1)
covered = (means-margins <= 100) & (100 <= means+margins)
coverage = float(covered.mean())
assert .93 < coverage < .97
print({'intervals': 5000, 'true_mean': 100, 'coverage': coverage})
The recorded simulation covers the true mean in 94.96% of intervals. It need not equal exactly 95% in a finite simulation. The sample and interval vary across repetitions; the simulated population mean remains 100.
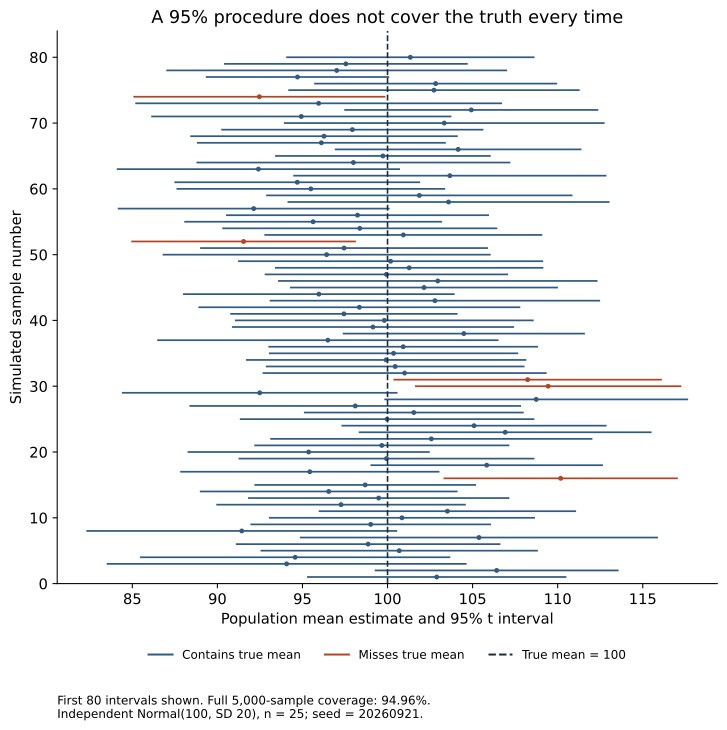
The figure displays the first 80 intervals from the same simulation, while the stated 94.96% coverage uses all 5,000. Each dot is a sample mean and each horizontal line its interval. A PNG version is available for review or presentation.
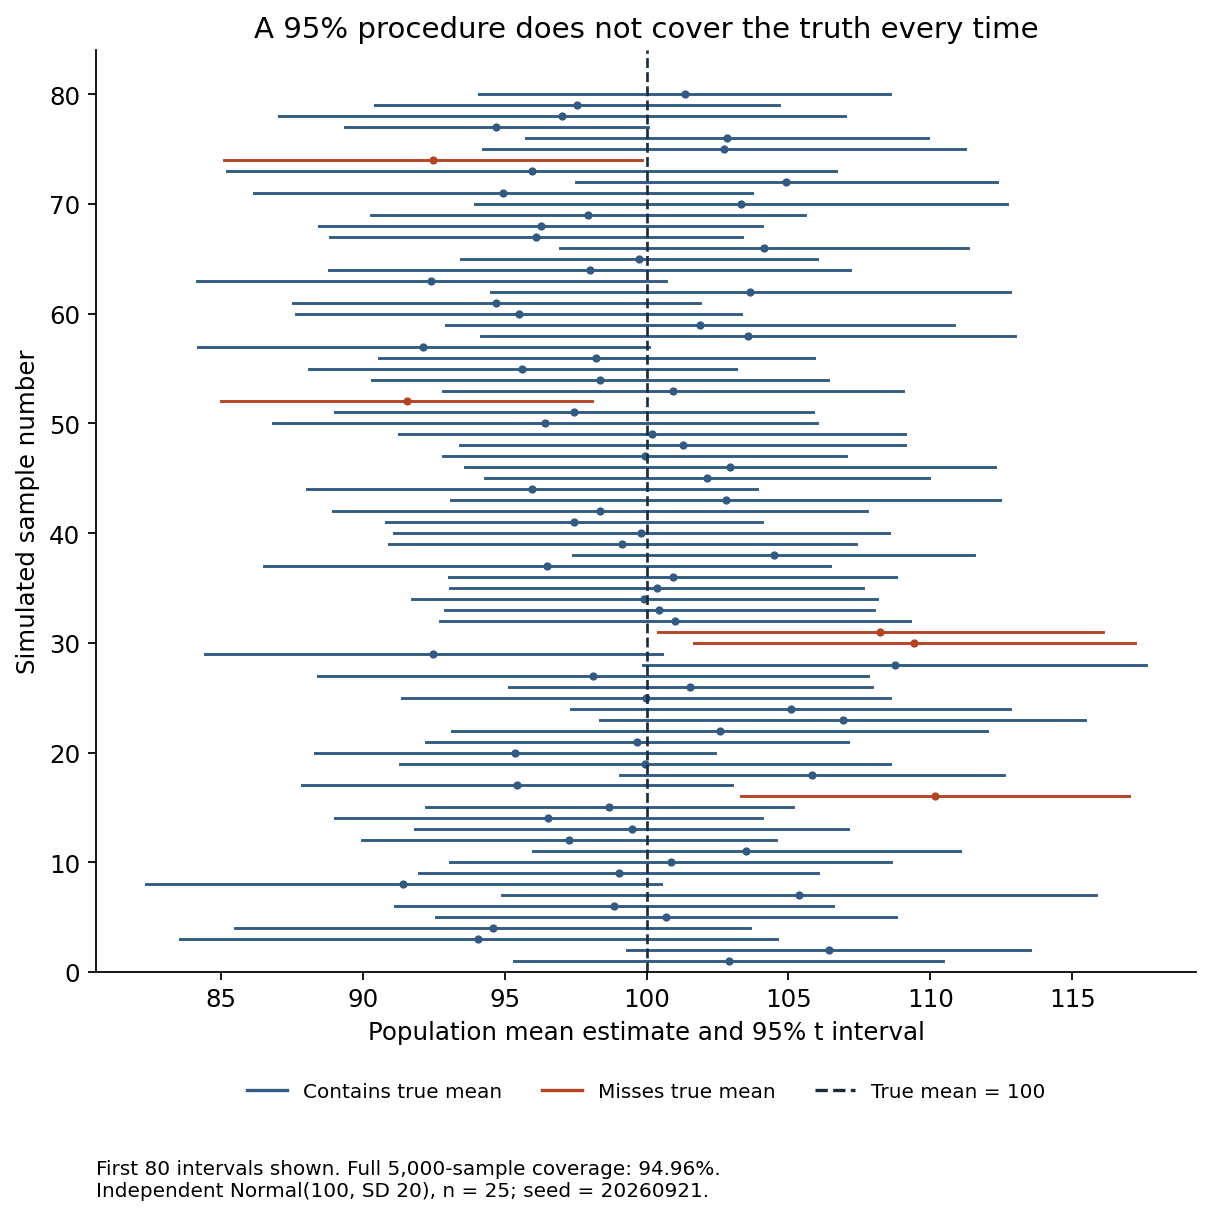
This demonstrates the procedure under independent normal sampling. It does not show that a biased or dependent business sample has the same coverage.
Distinguish a mean interval from an outcome range
An interval for the mean can be narrow even when individual outcomes vary widely. If the decision concerns a future individual delivery time, a prediction interval or another appropriate distributional summary is needed.
Similarly, a confidence interval is not the observed minimum-to-maximum range. These quantities answer different questions and should not share an unlabeled error-bar legend.
Interpret the width in decision units
Report the estimate and endpoints in the original unit. Ask whether the interval includes effects that would lead to different business actions. A narrow interval around a trivial effect and a wide interval spanning meaningful benefit and harm call for different interpretations.
Do not reduce the interval to whether it crosses zero without discussing practical magnitude. The method's assumptions and the decision threshold both matter.
Account for how the analysis was selected
Repeatedly trying outcomes, subgroups or stopping points and reporting only a favorable interval can undermine the nominal coverage interpretation. Define the primary estimand and analysis plan before inspecting results, or use a method designed for the selection process.
Missing data and nonrepresentative sampling can also create bias that an ordinary interval does not capture. A wider interval is not automatically a repair for an incorrect target population.
Exercise: calculate 90%, 95% and 99% intervals for the same control scores. Verify that higher confidence widens the interval, then explain why changing the confidence level after seeing which result looks persuasive is a poor reporting practice.
NeuraPath's Data Analytics with Generative AI course connects uncertainty calculations with clear communication. A useful interval states what it estimates and what its assumptions leave unresolved.
Continue learning
This article is part of the Statistics for analytical decisions sequence. Use the neighbouring tasks when you need the prerequisite or the next application.
- Review the prerequisite or neighbouring task in Standard deviation versus standard error with a simulation.
- Continue with Choose a t-test from the question and data design.
Pankit Kumar has 10 years in Data Science & AI, building and shipping production systems in regulated pharma and clinical environments. He is a freelance trainer at Boston Institute of Analytics, AnalytixLabs and Scaler, and has taught this material to thousands of working professionals.
This article is part of our Data Analytics with Generative AI programme — 3–4 months. The full analyst stack — Excel, SQL, Power BI and Python pipelines — then a generative-AI layer you can prove is right.
Explore Data Analytics with Generative AI